Training Load
Fitness, fatigue, and form, at a glance.
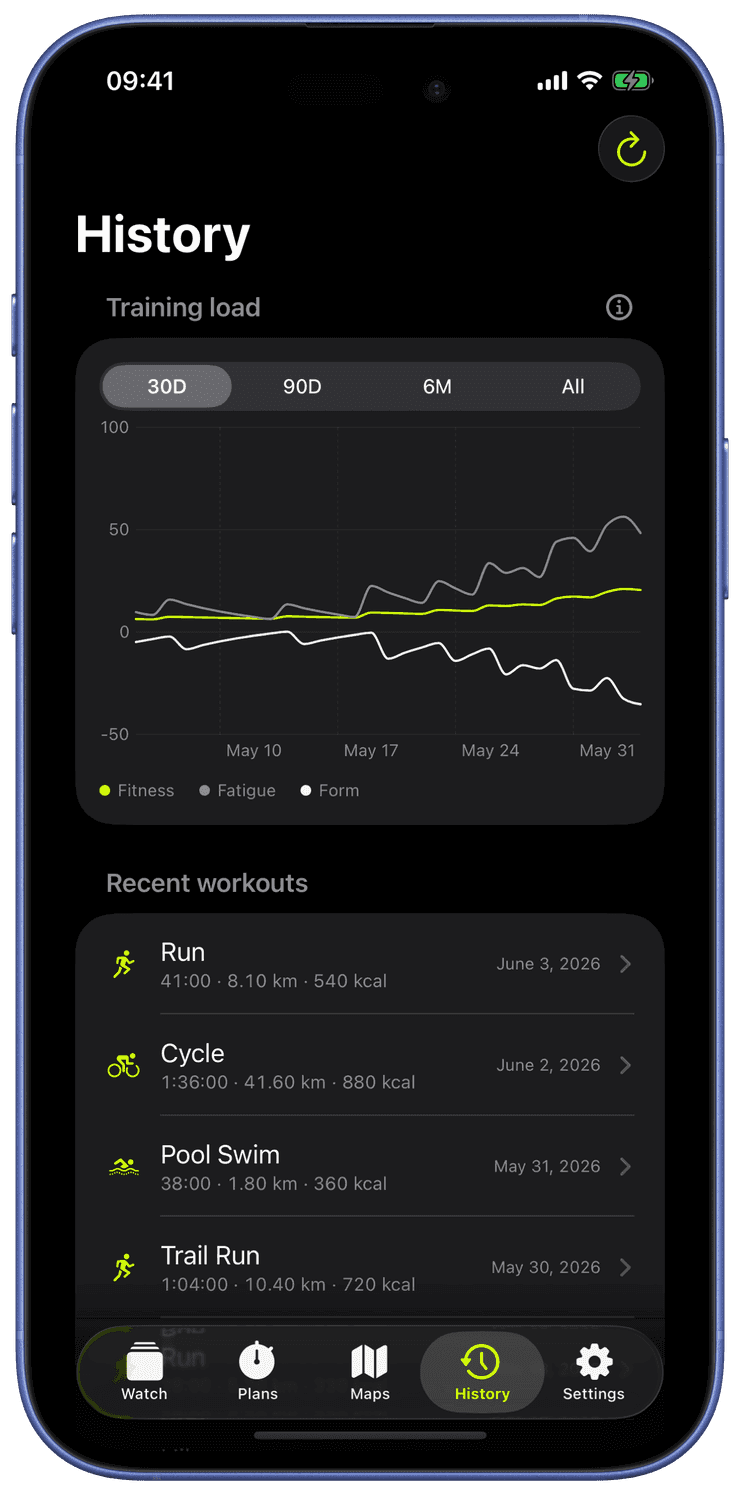
Runara computes a daily training-load chart from your workouts: CTL (a 42-day average, your “fitness”), ATL (a 7-day average, your “fatigue”), and TSB (the balance between them, your “form”).
Sessions are scored with a Banister TRIMP model when heart rate is available, falling back to active energy or duration otherwise. Drag the day cursor to read any point in your build-up, all computed on-device from the workouts already in Apple Health.
The verdict follows you out of the app. Three watch-face complication families, Training Load, Training Week, and Fitness & Fatigue, put a TSB gauge, a readiness-tinted week of load columns, or the raw CTL/ATL/TSB numbers right on your watch face. On the iPhone, a Readiness Gauge and a Training Week board bring the same picture to the Home Screen and Lock Screen, each day tinted by its readiness verdict: fresh, ready, fatigued, or rest.
Every workout earns a load score: Banister TRIMP when average heart rate exists, duration weighted by how deep into your heart-rate reserve you went, otherwise active energy, otherwise minutes. Effort scores, not distance, so a hard erg piece and a hilly run compare fairly.
Daily loads feed two moving averages: CTL, the 42-day curve that builds slowly, your fitness, and ATL, the 7-day curve that spikes fast, your fatigue. Rest days count as zero, they are how ATL falls.
TSB, your form, is yesterday’s fitness minus yesterday’s fatigue: positive means fresh, sharply negative means overreached. The chart computes over your last 180 days so every surface shows the same converged numbers.
The verdict, fresh, ready, fatigued, or rest, plus a “ready in ~N days” projection, rides on complications and widgets, so tomorrow’s decision is on your watch face tonight.
Fitness, fatigue, and form
Runara turns months of workouts into one readable picture. Here is the same model the History tab draws. Hover or drag across the chart to read any day.
Hover or drag across the chart to scrub through the block. You can also focus the chart and step through days with the arrow keys.
How it works
Every workout is an impulse
Each session is scored as a training impulse, a Banister TRIMP from your heart rate, or from active energy and duration when heart rate isn't available.
Two moving averages
Fatigue follows the last ~7 days and reacts fast. Fitness follows ~42 days and changes slowly. Train hard and fatigue spikes while fitness inches upward.
Form is the gap
Form is Fitness minus Fatigue. It drops negative while you load, then turns positive as fatigue fades faster than fitness, which is exactly why a taper makes you feel fast.
The fitness–fatigue model
The chart is the Banister impulse-response model from the 1970s: your readiness rises with fitness and falls with fatigue. Because fatigue decays faster than the fitness you built, rest doesn't erase your work. It reveals it as positive form. Runara computes all of this on-device from the workouts already in Apple Health.
τfitness = 42d · τfatigue = 7d
What do CTL, ATL, and TSB actually mean?
Chronic Training Load is a 42-day weighted average of your daily effort, the slow curve that represents fitness. Acute Training Load is the same idea over 7 days, fatigue. Training Stress Balance is their difference, form: train hard and TSB dips, absorb the work and it climbs back past zero, which is when you feel fresh. It is the classic Banister/Coggan model, computed on your device.
How is this different from Apple’s Training Load?
Apple compares your last 7 days of effort against your last 28. Runara runs the full CTL/ATL/TSB model instead: separate fitness and fatigue curves, a signed form number, and a readiness verdict with a recovery projection, the same framework coaches and platforms like TrainingPeaks built their planning on.
Do all sports count toward training load?
Yes, because the score is effort-based, not sport-based: heart rate first, energy or duration as fallbacks. A yoga hour counts gently, a trail race counts heavily, exactly as your body experienced them.
What is TRIMP, in one breath?
Training Impulse: workout minutes multiplied by an exponential weighting of how close your average heart rate sat to your maximum. Twenty easy minutes score little; twenty minutes near threshold score a lot, which is the whole point.